| URLs in this document have been updated. Links enclosed in {curly brackets} have been changed. If a replacement link was located, the new URL was added and the link is active; if a new site could not be identified, the broken link was removed. |
![]()
An Analysis of Selected Data Practices: A Case Study of the Purdue College of Agriculture
Line Pouchard
Assistant Professor and Computational Science Information Specialist
pouchard@purdue.edu
Marianne Stowell Bracke
Professor and Agricultural Sciences Information Specialist
mbracke@purdue.edu
Purdue University Libraries
West Lafayette, Indiana
Abstract
This paper describes a survey of data practices given to the Purdue College of Agriculture. Data practices are a concern for many researchers with new governmental funding mandates that require data management plans, and for the institution providing resources to comply with these mandates. The survey attempted to answer these questions: What are the characteristics of the data held by respondents? What tools do the respondents use in managing, analyzing, or manipulating their data? Where do students primarily learn research data management skills? The survey documents that there is a statistically significant difference in data holding sizes between faculty and graduate students, and that MS-Excel is still the analysis tool of choice. Results also showed that many researchers in the College were not thinking of the Libraries as a resource for data management practices, preservation, or data literacy instruction for graduate students. The survey results may inform the Libraries in developing new data services and instruction, while also highlighting the need for additional research into data practices for specific disciplinary areas or types of researchers.
Introduction
As science becomes more data intensive, universities are exploring ways to provide resources for storing, preserving and generally making this data available to comply with federal agency requirements. In parallel, recent research has characterized scientists' needs and behaviors surrounding data sharing practices and perceptions (Tenopir 2011); access to specific types of data, such as biodiversity data (Davis 2014); and the perception that data sharing can support the land grant mission of an institution (Fernandez 2016). However, in order to guide the development of customized services at the local level, it is necessary to characterize these needs in a more granular fashion. For this purpose, the authors designed a case study to analyze select data practices in the College of Agriculture (hereafter referred to as the College) at Purdue University, a land-grant institution for the State of Indiana.
We administered a survey to answer the following three research questions:
- What are the characteristics of the data held by respondents, including how much data do they have?
- What tools do the respondents use in managing, analyzing, or manipulating their data?
- Where do students primarily learn research data management skills?
These questions were framed to study respondents' interaction with data along the dimensions of data management and curation, and data information literacy skills. The purpose was to obtain insights into the needs of the College with regards to services that the libraries and other units, such as the information technology office, could offer. In this paper we present our results in a case-oriented analysis. Based on these results, we offer recommendations for services that would fill those needs, and propose a plan of action to implement them. In addition, the authors discuss the training opportunities that have been uncovered and how they are being addressed in the Purdue University College of Agriculture.
The College consists of 11 departments and Agricultural Extension. These departments cover a wide range of disciplines, including the life and applied sciences, engineering, and the social sciences. The variety of disciplines and departments found in the Purdue College of Agriculture is not unique and is also described for two other land grant institutions (Fernandez, Eaker, Swauger & Davis 2016). This diversity is reflected in the data challenges faced by the College. Some disciplines have well-established data repositories, such as ICPSR for the social sciences, and NCBI and Genbank for genomics. Many others, though, do not have standard data practices for description, depositing, or long-term storage, and are being challenged by new funding mandates to make data more, if not publicly, available. Additionally, research with individual faculty members and graduate students in the College illustrated that data issues, particularly data management, presents difficulties even within lab groups (Bracke & Fosmire 2015; Carlson & Bracke 2015). These communities face impediments which include: frequent staff and student turnover, lack of training, confusing or under-sourced campus resources, and insufficient time or money to address these issues.
The libraries have developed a strong relationship with the College's Senior Associate Dean for Research and Faculty Affairs. This Dean sees great potential in meeting data challenges head-on, and is supportive of the librarians utilizing their skills in description, curation, data literacy, and preservation to benefit the College as a whole. Her priority is to meet the needs of all the departments within the College, even if they may be quite disparate. In this the libraries need to follow her lead initially, even if that means suggesting an array of services to meet different needs.
Literature Review
The 2010 Office of Science and Technology Policy (OSTP) memorandum on scientific collections brought research data management to the scientific community's attention by requiring major federal funders to create mandates for data sharing (Holdren 2010). The National Science Foundation (NSF) mandate of data management plan requirements, one of the first to be implemented, is a driving concern among faculty about new data expectations. However, researchers are struggling with the lack of clear expectations, and are open to assistance in writing data management plans and specific skills, such as identifying and applying metadata standards (Steinhart, Chen, Arguillas, Dietrich, & Kramer 2012). The United States Department of Agriculture (USDA) released their response to the OSTP memo in November 2014 and continued to request stakeholder feedback through January 2016 (USDA 2014). Though not finalized, it is clear that USDA expects data management plans to be included in future grant requests, and encourages data from USDA-funded research be shared publicly to some degree.
Multiple studies have quantified and described research data management practice and attitudes. Some have focused on disciplinary or sub-disciplinary practices across the sciences, while others have focused on practices local to an institution. Tenopir et al. (2011) surveyed scientists across disciplines to describe attitudes and practices towards data sharing. The results highlighted many important aspects of data practice. First, it showed that while researchers may be willing to share their data under certain conditions, most do not develop full, descriptive annotations (i.e., metadata) to make their data understandable to other researchers (or even to themselves, as their research specifics may fade over time). The research also highlighted many disconnects. For example, there is a need to create cyberinfrastructure to move data sharing forward, but most institutions and funding agencies are not providing money to support this development. A survey by Diekema et al. (2014) of science researchers, sponsored programs offices, and institutional repository librarians showed that storage was a concern for all groups. Many researchers were unclear about what repositories were available, or even if their campus provided space for storing or sharing data. Most stored their data on local computers and external hard drives. However, most faculty were also very receptive to receiving help for sharing data, accessing data, copyright and intellectual property issues surrounding data, and data management. Steinhart et al. (2012) noted that while faculty were open to assistance in improving and implementing their own data practices and instruction for their students, they were not willing to pay for these additional services. This is something that libraries will need to be aware of as they develop new data service models.
Some studies have focused on agricultural disciplines. Williams (2012) chose a bibliographic method to survey the use and sharing of data in research for a Crop Sciences department, through analysis of recently published research. Her findings show that even across one department data practices vary broadly, making it difficult to define common practices. However, she did note that use of other datasets within research and sharing data (through repositories, web sites, etc.) is becoming more common over time. This is especially true in genetics given the proliferation of genetic databases and the expectation to deposit this information before publication. Diekmann (2012) took a qualitative approach, using in-depth interviews to investigate data experiences, practices, and perspectives across several field-based agricultural disciplines. His research showed that while many robust data practices are currently in place, they are often highly individualized (i.e., not easily generalizable), and susceptible to data loss over time due to technology changes, lack of consistent, meaningful description, hardware failures, and lack of long-term preservation guidelines. Fernandez, et al. (2016) surveyed researchers at two land-grant universities to gauge practice and attitudes towards data sharing, specifically in light of the land-grant mission towards service to a broader community. They saw that those who did see data sharing as supportive of the land-grant mission also tended to be the ones who shared their data or were willing to share.
It is important that researchers and graduate students have the skills to navigate the changing data environment. Libraries, as traditional centers of knowledge and learning cutting across disciplines, have the potential to be educators in the data environment (Heidorn 2011). This is especially true as it is unclear if researchers possess the skills, the interest in developing these skills, or the ability to pass these skills on to graduate students. Carlson, et al. (2011) set out 12 data competencies based on their research interacting with faculty on data practices. These competencies include data literacy competencies that could be taught by librarians, as well as broader skills (e.g., visualization) that could be the purview of researchers or other specialists. The mix of competencies, and who could teach them, shows that this environment is still in flux but that it will need a mix of professionals to create a data-literate individual. It is also imperative that context be taken into consideration as to whether this information is presented one-on-one, in classes, or in group settings (Carlson, Nelson, Johnston, & Koshoffer 2015).
Methods
We used populations from the College to generate a purposeful sample. Following Sandelowski (1995) we defined a purposeful sample as an instrument of qualitative research that takes events, phenomena, and experiences as its object of inquiry. In such samples, people are counted because they provide direct knowledge of the phenomena of interest and are a good source of information. In our case study, we analyzed the needs and practices related to scientific data in the Purdue University College of Agriculture. Examples of dimensions for this phenomenon include the volume of data that participants must store, and the means by which they believe graduate students acquire their data-related skills. We aimed for demographic variation in our survey by gathering responses through e-mails distributed in the College. In addition, we assumed that participants in the survey would be more likely to respond if they were interested in data-related questions. They would thus provide us with informationally significant results adequate for the purpose of the study (i.e., informing educational practices that the libraries can draw upon and use to make recommendations for data services to the College).
The Purdue Human Subjects Institutional Review Board approved this study as an online survey with the anonymity of respondents protected. The survey asked no identifying questions and this paper reports the findings in the aggregate. We sent out the survey via e-mail to College faculty, staff, and graduate students, and other demographic groups. The survey e-mail was initially sent on September 24, 2014, to be completed by October 24, 2014. After a reminder e-mail on October 29th, the survey was extended to November 7th to increase results. The survey contained four demographic questions and 19 questions about data practices and data literacy. (See Appendix A). The questions about data practices were based on a survey created by Tenopir et al. (2011). The data literacy questions were based on the 12 competencies discussed by Carlson et al. (2011). At the recommendation of the College administrator collaborator, the researchers customized the survey to take approximately 15 minutes to complete. Survey questions were intended to capture a snapshot of current practices and skills through the survey, so we did not ask any questions related to future plans about data. We received 140 responses, with 111 completing all questions. Several questions asked participants to check all responses that applied, as practices are not mutually exclusive. As a result, total count of responses may have exceeded 100% of respondents. Respondents had the option to skip questions.
The survey yielded 136 valid responses. In the analysis, we define "valid" as responses that included position description or departmental affiliation, with at least some responses to survey questions related to data. Respondents who answered only the demographics questions were removed.
In the analysis, we use responses associated with demographics as explanatory variables and perform chi-square statistic and Fisher's exact test and its associated probabilities to confirm or disprove a relationship between the demographic variable (independent) and the response to a question (dependent variable). We used the position of the respondent in the College as the independent variable. Position denotes Graduate Student, Professor, Associate Professor, Assistant Professor, Administrator, Researcher, Post-Doctoral Researcher, Laboratory Manager, and Other. Respondents were asked to only choose one -- their main position, in the case where participants had multiple positions. In the calculation of the test statistic, responses were aggregated into larger categories to reach the minimum threshold of 5 per cell required by the programs (SPSS). Mostly the categories of Professor, Associate, Assistant Professors, Researcher, and Post-Doctoral Researcher were aggregated; Graduate Students' responses remained a single category throughout; Other, Administrator, and Laboratory Manager were ignored for calculation of the tests but reported in the analysis if it was pertinent to the discussion. Variations on the aggregation into the professor/researcher category are noted for each individual result reported below when necessary. The researchers used official counts from the Purdue Data Digest, a compilation of student enrollment and faculty/staff data, to provide anecdotal insight into the percentage of the population that we reached. Some counts related to graduate students (total number and break-down by department) are confidential and were not available to us. Additionally, open text fields provided at the end of the survey noted where respondents' comments were solicited.
Results
Respondents:
The respondents were primarily characterized in terms of their position, but we were also interested in their departmental affiliation and the type of data that they generated or analyzed. The respondent's position was used to distinguish between faculty (or staff) and graduate students. This distinction was useful because faculty and staff have better access to and control over resources, for instance while pursuing funding for their research or obtaining internal university resources. Students, on the other hand, may have a better understanding of the gaps in their data training. The largest group of respondents were Graduate Students (41%, n=45), followed by Professors (20%, n=22), Other (7%, n=8), Assistant Professors (7%, n=8), Associate Professors (7%, n=8), Researchers (7%, n=7), Administrators (6%, n=6), Post-Doctoral (4%, n=4), and Lab Managers (3%, n=3).
Some faculty have appointments in multiple departments, or may also have State Cooperative Extension responsibilities. We asked respondents to select their primary affiliation. As reported in Figure 1, they identified with these departments: Agricultural Economics (15%, n=17), Agriculture and Biological Engineering (13%, n=18), Forestry and Natural Resources (12%, n=13), Agronomy (11%, n=12), Entomology (11%, n=14), Food Science (10%, n=12), Botany and Plant Pathology (8%, n=10), Biochemistry (7%, n=7), Animal Sciences (6%, n=6), Horticulture and Landscape Architecture (4%, n=5), Youth Development and Agricultural Education (4%, n=4), and Agricultural Extension (1%, n=1). Some respondents chose not to report their affiliation.
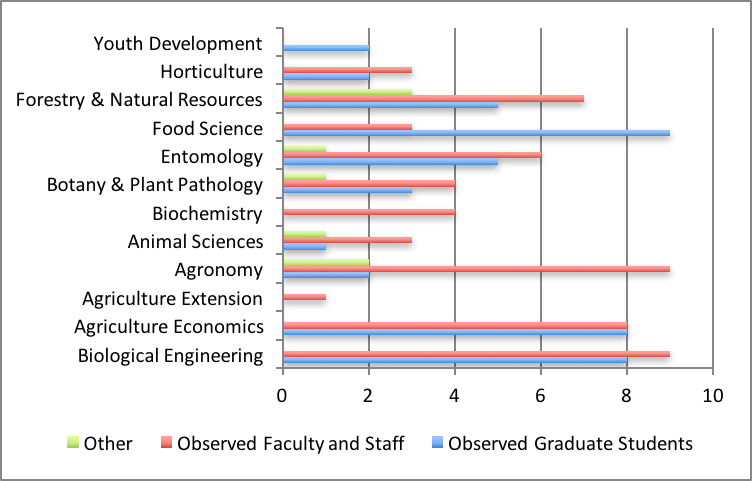
Figure 1: Breakdown of faculty and graduate student respondents by department. The categories of Administrator, Professor, Associate, Assistant Professor, Researcher, Post-Doctoral Researcher, and Lab Manager were aggregated into Faculty and Staff for this figure. The categories of Graduate Student and Other are not aggregated.
Data Sources:
An understanding of the respondents' data and funding sources provides the context for the following discussion of data sizes, storage devices, retention, and tools used to analyze the data. Sixty-three respondents indicated that they collect or use field data; 41 use or collect sequencing data; imaging and instrumental data such as mass spectrometers and tomographic instruments rank next at 32 and 31 respondents respectively (counts are reported here because respondents could choose multiple options).
Funding Agencies:
Twenty-two percent of respondents indicated that their data was proprietary. Respondents could define "proprietary" for their own research as researchers obtain funding from a broad range of organizations, including industry and private foundations. Funding sources included the federal government (42%) followed by Purdue University (26%). Only 31% indicated that the primary funding agency required a data management plan (DMP). Following the OSTP memo, 16 federal departments and agencies have issued public access plans covering publications and digital data. In this context, we note a perceived discrepancy between the number of respondents indicating the federal government as their primary funding source, and the number indicating that their primary funding agency has DMP requirements. Further investigation of this issue is needed to determine if this is the result of oversight, lack of awareness on the part of the respondent, non-finalized requirements from their funding agency, or something else, and develop a communication strategy about DMP requirements for the College of Agriculture.
Storage and data sizes:
We analyzed the number of responses focused on the total amount of data held by respondents. Respondents were asked to choose only one answer; segmented responses are as follows: under 1 GB , over 1 GB and under 1 TB, and over 1 TB. Results are shown in Figure 2.
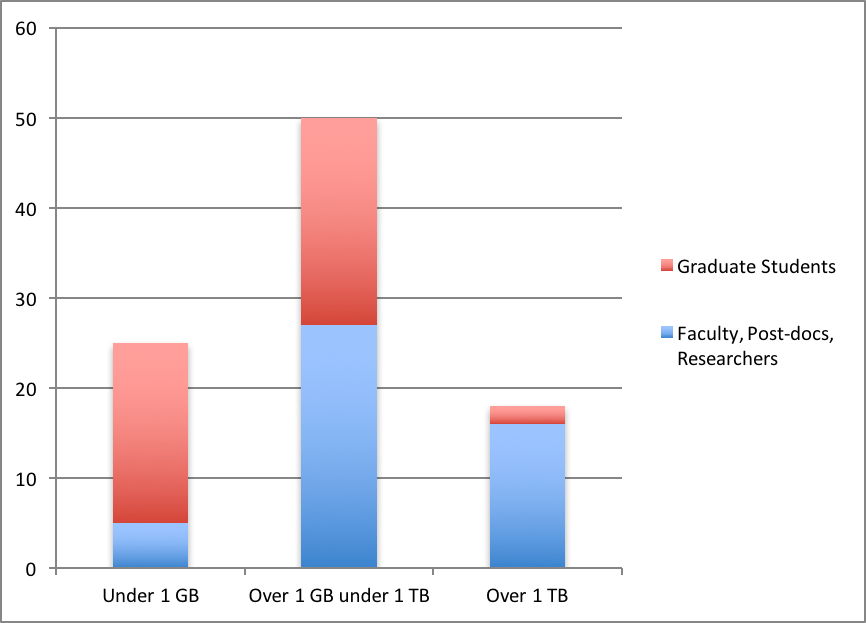
Figure 2: Faculty, Staff, and Graduate Students distribution with regard to the total size of data they hold. The categories of Administrator, Professor, Associate, Assistant Professor, Researcher, Post-Doctoral Researcher, and Lab Manager were aggregated into Faculty and Staff for this figure. This figure accounted for the total amount of participants responding to the question. Participants were asked to choose one option.
Data in Figure 2 show that faculty and staff have more data than graduate students. Fisher's Exact Test shows that there is a significant difference between the two categories (p = 2.084e-05) with regard to the amount of data being held, indicating a likely relationship between the amount of data being held and the position of the respondent.
When asked how long they wanted to retain their data, a majority of participants (75%) said that they wanted to retain their data permanently. Only 12% wanted to retain their data for the duration of the project, and 13% for another duration (1-7 years). In addition, respondents indicated that they currently store at least some data using the following storage options: 73% use their local computer, 65% use an external hard drive; 62% use Dropbox or Google drive, and 29% the institutional repository.
Tools
Researchers used a combination of data analysis tools which included open source software, commercial software, and software developed in-house. Figure 3 shows the number of respondents indicating their use of software tools. Results show that in the College Microsoft Excel is still the analytical tool of choice, with 93% of respondents indicating its use. This is followed by R (the statistical software) and SAS (43% each), SPSS (12%) and other statistical software including Stata, and JMP (16%).
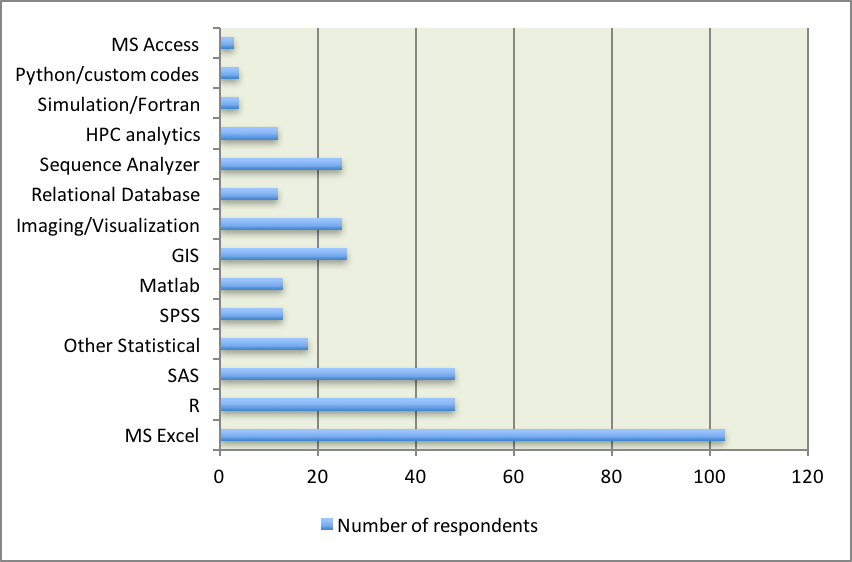
Figure 3: Number of respondents who indicated that they use an analytical tool. Respondents had the ability to choose more than one answer.
We examined the use of software tools by the survey respondents to understand whether their estimated data sizes had an impact upon their choice of tools. The total number of respondents was retained for this analysis, regardless of their position within the university (faculty, staff, and graduate students). We kept the same categories for size as in Figure 2 (under I GB, between 1 GB and 1 TB, and over 1 TB). The analysis showed that the choice of R as an analytical tool is associated with the size of datasets (chi-square = 7.5, p value of 0.023). Equally, the use of sequencer software is also related to large data sizes (chi-square = 20.8, p value inferior to 0.000). However, the data showed that there is no significant difference associated with the size of datasets for the use of Microsoft Excel (chi-square = 4.41, p value of 0.11).
Educational Component
In the educational section of the survey, the authors queried respondents about the importance of learning data management topics for students (Table 1) and where students primarily learn about data management practices (Table 2). Table 1 used the rubric for Data Information Literacy competencies developed by Carlson et al. (2011).
Table 1: How Important is it that students learn the following data management topics?
| Answer | Very Important | Somewhat Important | Not Important | Total Responses |
|---|---|---|---|---|
| Introduction to databases and data formats in their disciplines? | 72 | 33 | 4 | 109 |
| Search and acquisition of data | 80 | 28 | 1 | 109 |
| Data management and organization | 84 | 25 | 0 | 109 |
| Data conversion and interoperability | 56 | 43 | 8 | 107 |
| Quality assurance | 80 | 28 | 1 | 109 |
| Metadata (information that describes your data) | 62 | 42 | 3 | 107 |
| Data curation and re-use | 46 | 52 | 7 | 105 |
| Data practices, values and norms in their discipline | 72 | 32 | 5 | 109 |
| Data preservation | 62 | 39 | 7 | 108 |
| Data analysis | 98 | 10 | 1 | 109 |
| Data visualization | 75 | 31 | 2 | 108 |
| Ethics, including citation of data | 87 | 21 | 1 | 109 |
Table 2: Where do students primarily learn data management skills?
| Answer | # of Responses | % |
|---|---|---|
| In courses | 13 | 14% |
| in special instruction from the Libraries | 3 | 3% |
| During mentoring (faculty student) | 29 | 31% |
| In the lab (with peers) | 27 | 28% |
| Somewhere else (please specify) | 7 | 7% |
| They don't learn data management skills | 16 | 17% |
| Total | 95 | 100% |
Only 3% (n=3) responded that students learned data literacy skills from special instruction from the libraries and 17% (n=16) responded that students do not learn data management skills. The two highest selections were learning during Mentoring and In the Lab. Individual responses included: How-to videos on YouTube; the web site Stack Overflow; as an undergraduate; workshops and researching on their own time; internships; and "when they lose something due to poor skills." The responses showed a clear expectation that these skills are already known, self-taught, or learned through informal interaction but they are not a formal part of the current curriculum.
This highlights a need for increased promotion of the Libraries' data services, especially as they focus on data literacy. This lack of use of Libraries as a resource is a concern, as the Libraries have an agricultural sciences librarian, a data services department with four full-time librarians, and an institutional data repository in place to provide data services.
Discussion and Recommendations
This survey gathered general information about how faculty, staff, and graduate students in the College of Agriculture manage their research data. The results, though limited in areas, highlighted a number of issues and showed the clear need for additional, more specific research in understanding the data management and instruction opportunities. One limitation of a survey is that it is not always clear why respondents chose a particular answer: even if an open text box was provided for further clarification, it was not always used. While most respondents perceived all data literacy skills listed to be somewhat or very important, most respondents also identified a source (other than the libraries) where students learned these skills. This statement is inconsistent with earlier research conducted by Purdue researchers (Bracke & Fosmire 2015; Carlson & Bracke 2015). For example, in this earlier research faculty valued many of the competencies, yet were unaware of educational resources and were open to suggestions. This illustrates an area where current understanding is unclear and would benefit from more in-depth exploration to better understand if this might be a difference caused by disparate disciplines, expectations vs. actual practice, or another nuanced reason.
This research suggests that Libraries are not necessarily known as a provider of data management services, though the literature suggests that these services are a natural outgrowth of more traditional services (Heidorn 2011). Data literacy is one place to start (Carlson et al. 2011; Carlson & Bracke 2015). Even as this survey was underway, the Libraries began to approach this issue through offering a for-credit course on data management for College of Agriculture graduate students, drop-in workshops, and targeted lab group interventions. Furthermore, this research did not include undergraduate students as respondents, but they would be another logical population to introduce to data literacy. This would be particularly useful for those currently working in labs or preparing for graduate school.
Storage and preservation is another area of interest that impacts university infrastructure provided for research support. Diekmann reports that very few researchers have data management strategies that go beyond a single project and that storage and back-up are individualized, "highly fragmented activities." The distribution of respondents across the various storage options in our study confirms Diekmann's findings. However, 29% of Purdue respondents also report using the institutional repository, a centralized university resource that comprises data management best practices guidance and policies. This shows that if such a repository exists, researchers will use it, potentially alleviating the concerns about the lack of such systems reported by Dieckman.
Subsequent studies in the areas of selecting and preserving data in collections, and developing strategies for better awareness of their preservation services, would assist the libraries in avoiding misunderstandings regarding the reality of retaining data permanently. The fact that 75% of respondents want their data retained permanently suggests several issues for potential follow-up questions, such as the extent to which researchers understand the differences between storage and preservation, and the efforts required for providing access to their data for the long term. Moreover, given that the majority of respondents answered that they would like to keep their data "forever," libraries need to explore whether or not this is simply an ideal or an actual expectation on the part of researchers. This may be an area where librarians can help researchers understand what goes into preserving data for a realistic and appropriate amount of time for their needs. While scientists manage their data at the start of the data life cycle, data stewardship that includes migrating data for long-term preservation can only be done at the institutional level, whether at the university or disciplinary level (Lynch 2008). Individual scientists or single projects cannot alone provide stewardship for data (Borgman 2015). As data grows, there will be a need for guidelines for the selection process as to what is to be preserved and what is not (Pouchard 2016).
Unsurprisingly, faculty had more and larger data sets than graduate students. This does not address the usually more transitory nature of graduate students' data, as they are usually at the institution for a shorter period of time. This does mean that they may have slightly different motivations and experience in data management, which is useful for librarians to note in designing services. As an example of such services, we compiled a table of storage options at Purdue that students and faculty can use to determine the best solution for their needs and published it as a library resource (Pouchard et al. 2016).
The respondents also marked a broad range of tools used, and showed trends that were different from those found in available surveys of tools used by researchers. For instance, in a 2012 online poll, R (30.7%) was used on par with Excel (29.8%) for processing and analysis (Chen 2014). The results of the 2015 polls indicated that R is used by almost 47% of respondents and its use has been steadily growing in the last three years while Excel use has been declining to a current low of 23%. The discrepancy observed between the two groups of respondents with regard to the use of Excel may simply indicate that these groups use different tools to analyze their data. The poll reported by Chen focuses on Big Data. In our study, only two researchers identified that they had total data sizes exceeding 100 TB. However, Excel is used by most researchers in our study (93%) and there is no influence of data size on its use while the use of R is strongly correlated with data size. Librarians should continue to monitor this to see if the College has slower adopters of certain data tools, or if this marks a unique difference of these disciplines.
Conclusion
This research highlights the need for further, in-depth study of the College, particularly focusing on qualitative methods. A future study could yield a better understanding of how needs vary by department or discipline, and identify which data services should be strengthened or more aggressively promoted. It could help predict tools and storage needs so that the libraries can be better positioned to serve these needs. Future research might expand this study to look for common needs and behaviors across colleges of agriculture at multiple institutions.
Librarians can support emerging and existing data needs, especially in teaching data literacy, but researchers must be aware of these services to take advantage of them. Libraries must be more explicit in promoting the services. Many professions are active in establishing a stake in data services, but libraries are uniquely poised to play a leading role. Librarians are looking at small details and big implications. Librarians must also be explicit in the specific value proposition for data management. With this type of research, librarians can begin to summarize and present their usefulness to administrators, educators, faculty and students with data service needs. Library and information science professionals need to have an answer ready for the "why libraries?" question, and establish or strengthen their roles as data managers, data consultants and data literacy educators on campus and at administrative, disciplinary, national, and international levels.
References
Borgman, C.L., Darch, P.T., Sands, A.E., Pasquetto, I.V., Golshan, M.S., Wallis, J.C., & Traweek, S. 2015. Knowledge infrastructures in science: data, diversity, and digital libraries. International Journal on Digital Libraries 16(3), 207-227. doi: 10.1007/s00799-015-0157-z
Bracke, M.S. & Fosmire, M. 2015. Teaching data information literacy skills in a library workshop setting: A case study in agricultural and biological engineering. In: Carlson, J. and Johnston, L. R. editors. Data information literacy: Librarians, data, and the education of a new generation of researchers. West Lafayette (IN): Purdue University Press. p.129-148.
Carlson, J. & Bracke, M. 2015. Planting the seeds for data literacy: Lessons learned from a student-centered education program. International Journal of Digital Curation 10(1), 95-110. doi:10.2218/ijdc.v10i1.348
Carlson, J., Fosmire, M., Miller, C.C., & Nelson, M.S. 2011. Determining data information literacy needs: A study of students and research faculty. portal: Libraries and the Academy 11(2): 629-657. doi:10.1353/pla.2011.0022
Carlson, J., Nelson, M.S., Johnston, L.R. & Koshoffer, A. 2015. Developing data literacy programs: Working with faculty, graduate students and undergraduates. Bulletin of the American Society for Information Science and Technology 41(6): 14-17. doi:10.1002/bult.2015.1720410608
Chen, M., Mao, S., Zhang, Y. & Leung, V.C. 2014. Big Data Analysis. Big Data (pp. 51-58): Springer.
Davis, M.L.E.S., Tenopir, C., Allard, S. & Frame, M.T. 2014. Facilitating access to biodiversity information: A survey of users' needs and practices. Environmental management 53(3), 690-701. doi:10.1007/s00267-014-0229-7
Diekema, A.R., Wesolek, A., & Walters, C.D. 2014. The NSF/NIH effect: Surveying the effect of data management requirements on faculty, sponsored programs, and institutional repositories. The Journal of Academic Librarianship 40(3), 322-331. doi:10.1016/j.acalib.2014.04.010
Diekmann, F. 2012. Data practices of agricultural scientists: Results from an exploratory study. Journal of Agricultural & Food Information 13(1): 14-34. doi:10.1080/10496505.2012.636005
Fernandez, P., Eaker, C., Swauger, S. & Davis, M.S. 2016. Public progress, data management, and the land grant mission: a survey of agriculture researchers' practices and attitudes at two land-grant institutions. Issues in Science and Technology Librarianship. doi: 10.5062/F49P2ZNN
Heidorn, P.B. 2011. The emerging role of libraries in data curation and e-science. Journal of Library Administration 51(7-8), 662-672. doi:10.1080/01930826.2011.601269
Holdren, J.P. 2010. Memorandum for the Heads of Executive Departments and Agencies. [Internet] 2016 October 14. Washington (DC): Office of Science and Technology Policy. Available at {https://web.archive.org/web/20161111072433/https://www.whitehouse.gov/sites/default/files/microsites/ostp/scientific-integrity-memo-12172010.pdf}
KDNuggets. [Internet] 2016 March 23. Available at http://www.kdnuggets.com/polls/2015/analytics-data-mining-data-science-software-used.html#table
Lynch, C. 2008. Big data: How do your data grow? Nature, 455(7209), 28-29. doi:10.1038/455028a
Pouchard, L.C. 2016. Revisiting the data life cycle with big data curation. International Journal of Digital Curation. 10(2): 176-192. doi:10.2218/ijdc.v10i2.342
Pouchard, L.C., Bracke, M.S. & Nelson, M.S. [Internet] 2016, October 24. Data storage options at Purdue libguide. Available at http://guides.lib.purdue.edu/DataStorage
Sandelowski, M. 1995. Sample size in qualitative research. Research in nursing & Health. 18(2): 179-183. doi:10.1002/nur.4770180211
Steinhart, G., Chen, E., Arguillas, F., Dietrich, D. & Kramer, S. 2012. Prepared to plan? A snapshot of researcher readiness to address data management planning requirements. Journal of eScience Librarianship 1(2): 1. doi:10.7191/jeslib.2012.1008
Tenopir, C., Allard, S., Douglass, K., Aydinoglu, A.U., Wu, L., Read, E., Manoff, M. & Frame, M. 2011. Data sharing by scientists: practices and perceptions. PloS one 6(6), e21101. doi:10.1371/journal.pone.0021101
United States Department of Agriculture. 2014. Implementation Plan to Increase Public Access to Results of USDA-funded Scientific Research. [Internet] Washington (DC): United States Department of Agriculture. Available at http://www.usda.gov/documents/USDA-Public-Access-Implementation-Plan.pdf
Williams, S.C. 2012. Data practices in the crop sciences: A review of selected faculty publications. Journal of Agricultural & Food Information 13(4), 308-325. doi:10.1080/10496505.2012.717846
Acknowledgements:
We wish to thank the Purdue Statistical Consulting Service for their help with the analysis, the reviewers for their thoughtful comments, and Dr. Karen Plaut, Senior Associate Dean for Research and Faculty Affairs in the Purdue College of Agriculture for her continuous support and engagement with data management, our work and the Purdue University Libraries.Appendix A: Survey instrument of the Purdue University College of Agriculture
- 1) What is your primary departmental affiliation?
- Agriculture and Biological Engineering
- Agricultural Economics
- Agricultural Extension
- Agronomy
- Animal Sciences
- Biochemistry
- Botany and Plant Pathology
- Entomology
- Food Science
- Forestry and Natural Resources
- Horticulture and Landscape Architecture
- Youth Development and Agricultural Education
- 2) What is or are the discipline(s) or subject(s) to which your data relate?
- Comment Box: Identify the discipline(s) or subject areas to which your data relate
- 3) My current position is (choose primary):
- Administrator
- Assistant Professor
- Associate Professor
- Professor
- Graduate Student
- Lab manager
- Lecturer
- Post-Doctoral Fellow
- Researcher
- Other (please specify)
- 4) My age group is
- Younger than 25
- 25-34
- 35-44
- 45-54
- 55-64
- 65 and older
- The next group of questions refers to your research data.
- 5) Which terms best describe your data sources and/or methods of collection (Choose all that apply)
- Sequencing data
- Microarrays
- Field data
- Big instruments data (e.g. mass spectrometer, tomographic instruments, neutron source, other)
- Remote-sensing data
- Images
- Simulation data (model output)
- Human subject data (e.g. interviews, surveys, focus groups)
- Medical data (e.g. health records)
- Government data (inc. international and NGOs)
- Other: please specify
- 6) Are your data proprietary or sensitive?
- Yes
- No
- 7) Which of the following best describes the primary funding agency for your research (select one)?
- Federal/national government
- State/regional government
- Local government
- Corporation
- Private Foundation
- My own institution
- Other (Please specify)
- 8) Does your primary funding agency require you to provide a data management plan?
- Yes
- No
- 9) Think about the raw datasets that you routinely handle in the course of a study. On average, what is the size of these datasets? (please choose one)
| Individual datasets | Total amount of datasets |
|---|---|
| Under 1 MB | Under 1 MB |
| Over 1 MB but under 1 GB | Over 1 MB but under 1 GB |
| Over 1 GB but under 1 TB | Over 1 GB but under 1 TB |
| Over 1 TB | Over 1 TB |
- 10) What tools do you use to analyze your data? (choose all that apply)
- Excel
- R
- SAS
- SPSS
- Matlab
- GIS
- Imaging software
- Relational databases
- Sequencer software
- High Performance Computing analytics
- Other (please specify)
- 11) Think about the analyzed datasets. On average, what is the average size of these?
- Under 100K
- Over 100K but under 1 MB
- Over 1 MB but under 1 TB
- Other
- 12) The following statements relate to custom-made computer programs that you might use to manipulate data during the course of a study. How much do you agree with the following statements?
- I do not use custom-made computer programs to manipulate data
| strongly agree | somewhat agree | somewhat disagree | strongly disagree | not sure |
- It is very important to preserve these programs for my research
| strongly agree | somewhat agree | somewhat disagree | strongly disagree | not sure |
- It would be beneficial for my research community to publish these programs
| strongly agree | somewhat agree | somewhat disagree | strongly disagree | not sure |
- 13) Think about the complexity of your data. Which following statement about your data is true? (choose all that apply)
- I create, collect, or analyze numerous datasets (several hundreds and more) in a single study
- I create, collect, or analyze heterogeneous data from multiple sources for a single study
- I create, collect, or analyze datasets at multiple scales
- I create, collect, or analyze datasets that stream from one or several sensors
- I create, collect or analyze videos
- My analyses are becoming more difficult because of the variety and types of data sources
- Other (Please specify)
- 14) How much of your data do you currently store in the following locations (please choose all that apply)?
- On email
| 0% | Less than 20% | Between 20 and 80% | More than 80% | 100% |
- On my computer or storage device
| 0% | Less than 20% | Between 20 and 80% | More than 80% | 100% |
- On a departmental or lab server or storage device
| 0% | Less than 20% | Between 20 and 80% | More than 80% | 100% |
- In my institution's repository
| 0% | Less than 20% | Between 20 and 80% | More than 80% | 100% |
- In a community-based repository (external to the university)
| 0% | Less than 20% | Between 20 and 80% | More than 80% | 100% |
- On commercial cloud-storage (Amazon, etc.)
| 0% | Less than 20% | Between 20 and 80% | More than 80% | 100% |
- Dropbox, Google-drive, etc.
| 0% | Less than 20% | Between 20 and 80% | More than 80% | 100% |
- On paper in an office
| 0% | Less than 20% | Between 20 and 80% | More than 80% | 100% |
- On Big Data storage (e.g. Hadoop, SPARQ)
| 0% | Less than 20% | Between 20 and 80% | More than 80% | 100% |
- Other: please specify
- 15) How long do you need to retain your data (choose all that apply)?
- 1 year
- 2 years
- 3-5 years
- the duration of the project
- permanently
- other: (please specify)
- 16) Metadata is information about your datasets that describes characteristics of your data and may be used for searches. What metadata (if any) do you use to describe your data? (choose all that apply)
- None
- Metadata that I created for personal use
- Metadata created for use in my lab
- Metadata standards or web forms used within my disciplinary community
- Other (please specify)
- 17) The following statements relate to how you collect and use research data. Tell us how much you agree with the following ways to complete this sentence:
- I am satisfied with the...
- Process for collecting data
| strongly agree | somewhat agree | somewhat disagree | strongly disagree | not sure |
- Process for cataloging or describing data
| strongly agree | somewhat agree | somewhat disagree | strongly disagree | not sure |
- Process for storing my data during the life of the project
| strongly agree | somewhat agree | somewhat disagree | strongly disagree | not sure |
- Process for storing my data beyond the life of the project
| strongly agree | somewhat agree | somewhat disagree | strongly disagree | not sure |
- Process for searching my own data
| strongly agree | somewhat agree | somewhat disagree | strongly disagree | not sure |
- Process for analyzing my data
| strongly agree | somewhat agree | somewhat disagree | strongly disagree | not sure |
- Tools for preparing metadata
| strongly agree | somewhat agree | somewhat disagree | strongly disagree | not sure |
- Tools for preparing data documentation
| strongly agree | somewhat agree | somewhat disagree | strongly disagree | not sure |
- Please elaborate:
- Tools
- The following statements relate to data sharing and access.
- 18) Tell us how much you agree with each statement.
- I share my data with collaborators (widely defined)
| strongly agree | somewhat agree | somewhat disagree | strongly disagree | not sure |
- I share my data with my students
| strongly agree | somewhat agree | somewhat disagree | strongly disagree | not sure |
- I share my data within my lab
| strongly agree | somewhat agree | somewhat disagree | strongly disagree | not sure |
- Others need my permission or input to access my data
| strongly agree | somewhat agree | somewhat disagree | strongly disagree | not sure |
- My data are publicly available
| strongly agree | somewhat agree | somewhat disagree | strongly disagree | not sure |
- I deposit my data at time of publication
| strongly agree | somewhat agree | somewhat disagree | strongly disagree | not sure |
- I do not share my data
| strongly agree | somewhat agree | somewhat disagree | strongly disagree | not sure |
- 19) If all or part of your data are not available to others, please tell us why? (choose all that apply)
- My data are available publicly
- Lack of resources (funding, staff, time)
- Lack of standards
- It is not customary in my field
- There is no place to put them
- The sponsor does not require it
- I don't have the rights to make the data available
- I would lose control of the data
- I am withholding it until publication
- Other (please specify)
- The final questions are about students' needs to learn data management topics
- 20) Where do students primarily learn data management skills?
- In courses
- In special instruction from the Libraries
- During mentoring (faculty-student)
- In the lab (with peers)
- Somewhere else (Please specify)
- They don't learn data management skills
- I don't know
- 21) How important is it that students learn the following data management topics?
- Introduction to databases and data formats in their discipline
| Very Important | Somewhat important | Not important |
- Search and acquisition of data
| Very Important | Somewhat important | Not important |
- Data management and organization
| Very Important | Somewhat important | Not important |
- Data conversion and interoperability
| Very Important | Somewhat important | Not important |
- Quality assurance
| Very Important | Somewhat important | Not important |
- Metadata (information that describes your datasets)
| Very Important | Somewhat important | Not important |
- Data curation and re-use
| Very Important | Somewhat important | Not important |
- Data practices, values and norms in their discipline
| Very Important | Somewhat important | Not important |
- Data preservation
| Very Important | Somewhat important | Not important |
- Data analysis
| Very Important | Somewhat important | Not important |
- Data visualization
| Very Important | Somewhat important | Not important |
- Ethics, including citation of data
| Very Important | Somewhat important | Not important |
- Other (please specify)
- If you have questions or comments that are not covered, feel free to leave comments
- Follow-up:
- If you would like us to contact you directly about matters regarding data, please indicate this in the comment box below leaving your email address OR contact us directly (this method preserves the anonymity of your survey results).
| Previous | Contents | Next |

This work is licensed under a Creative Commons Attribution 4.0 International License.
